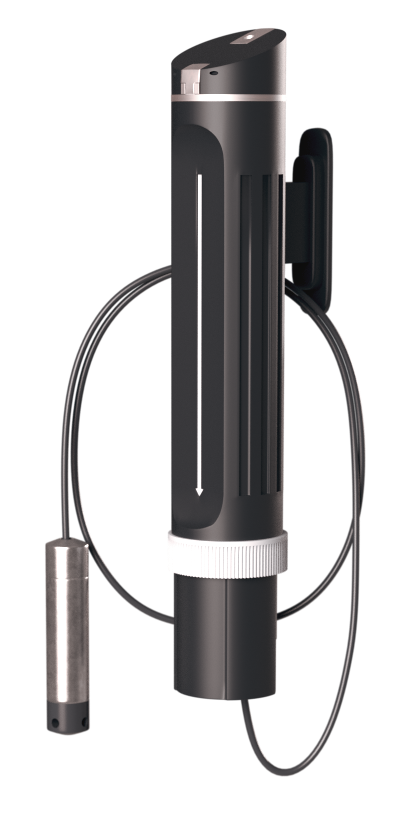
Water level sensor and platform
SmartBrønd's water level sensor and platform give you a clear, visualised overview of any climate adaptation project. Get precise insight into how your installation is performing and make better decisions based on real-time data.
Real-time data
Direct insight into how your installation is performing, with fast and reliable real-time data
User-friendly platform
Make better decisions based on understandable data and automated analysis
Optimised operation
Optimise capacity utilisation based on actual usage, and receive alerts on abnormal operation
Intelligent water level monitoring
SmartBrønd's water level sensor can be remotely configured with both measurement interval and transmission interval. The sensor is battery-powered with a 1–3 year lifetime under normal use. There is no wiring between individual loggers, and they can communicate through both concrete manholes and metal covers.
Compatibility
The sensor can be installed in any new or existing manhole, monitoring well, or attached at a waterfront edge.
Features
The sensor delivers reliable monitoring of water level and provides real-time visualisation through our dashboard. It is designed to operate in harsh water environments and is self-powered, making it well suited for sites with limited access to power.
Applications
Ideal for monitoring stormwater projects where rainfall must be retained and managed. Equally well suited to groundwater logging, cloudburst events, and any application where you need to know the utilisation rate of an installation.
Technical specifications
Logging
- Parameters: Water level and temperature
- Accuracy: ≤ ±0.1% FSO (max deviation 10 mm, typically 3–5 mm)
- Default log interval: once per minute
- Default transmission frequency: every 2 hours
- Log interval and transmission frequency can be adjusted from the dashboard. For e.g. a pump test, the log interval can drop to 10 seconds and transmissions to every 30 seconds.
Power
- Battery life: 1–3 years under normal operation
- Battery type: LiSOCl₂ D-cell
- External power: 6.5–30 V DC supply available
- Power consumption: optimised for long battery life
- Battery monitoring: automatic alerts on low battery
Physical specifications
- Measurement depth: standard 10 m (max 40 m)
- Pressure transmitter size: Ø26.5 mm
- Data logger and transmitter size: Ø50 mm
- Operating temperature: -10 to 70 °C
- Protection rating: IP 68
- Materials: stainless steel (316L) and plastic
Communication & security
- Network: NB-IoT by default; all GSM networks supported
- Server: data is forwarded via SmartBrønd's server by default
- Processor: Nordic NRF9160 with ARM TrustZone security
- Encryption: end-to-end AES-128 on all data
- Security: hardware root-of-trust and secure boot
The platform
On SmartBrønd's digital platform, data from the sensor is translated into clear, user-friendly information that supports both day-to-day operations and long-term optimisation of a climate adaptation project.
The platform can present multiple loggers or projects, giving a broader understanding of the overall hydraulic balance.
Inspection and operations
The water level sensor performs a daily inspection of the installation. If something is off — for example, the flow regulator is clogged — you'll see it on the platform within a day. This makes it possible to maintain and operate the project efficiently, so it always performs at its best.
Optimisation
The platform can show how a climate adaptation project can best be optimised. With sensor data you can see the project's actual utilisation rate. If the rate is low, the platform shows where more catchment can be connected so capacity is used to its full potential.
Data and integration
The platform exposes water level, water volume, and water-surface elevation, which sharpen optimisation decisions. It correlates data with rainfall data sources and lets you change outflow rate on a controllable flow regulator in line with weather forecasts.
Examples of platform features
Figure 1
The platform shows precisely where each sensor in a project is located, giving an immediate overview of where additional catchment could be connected.
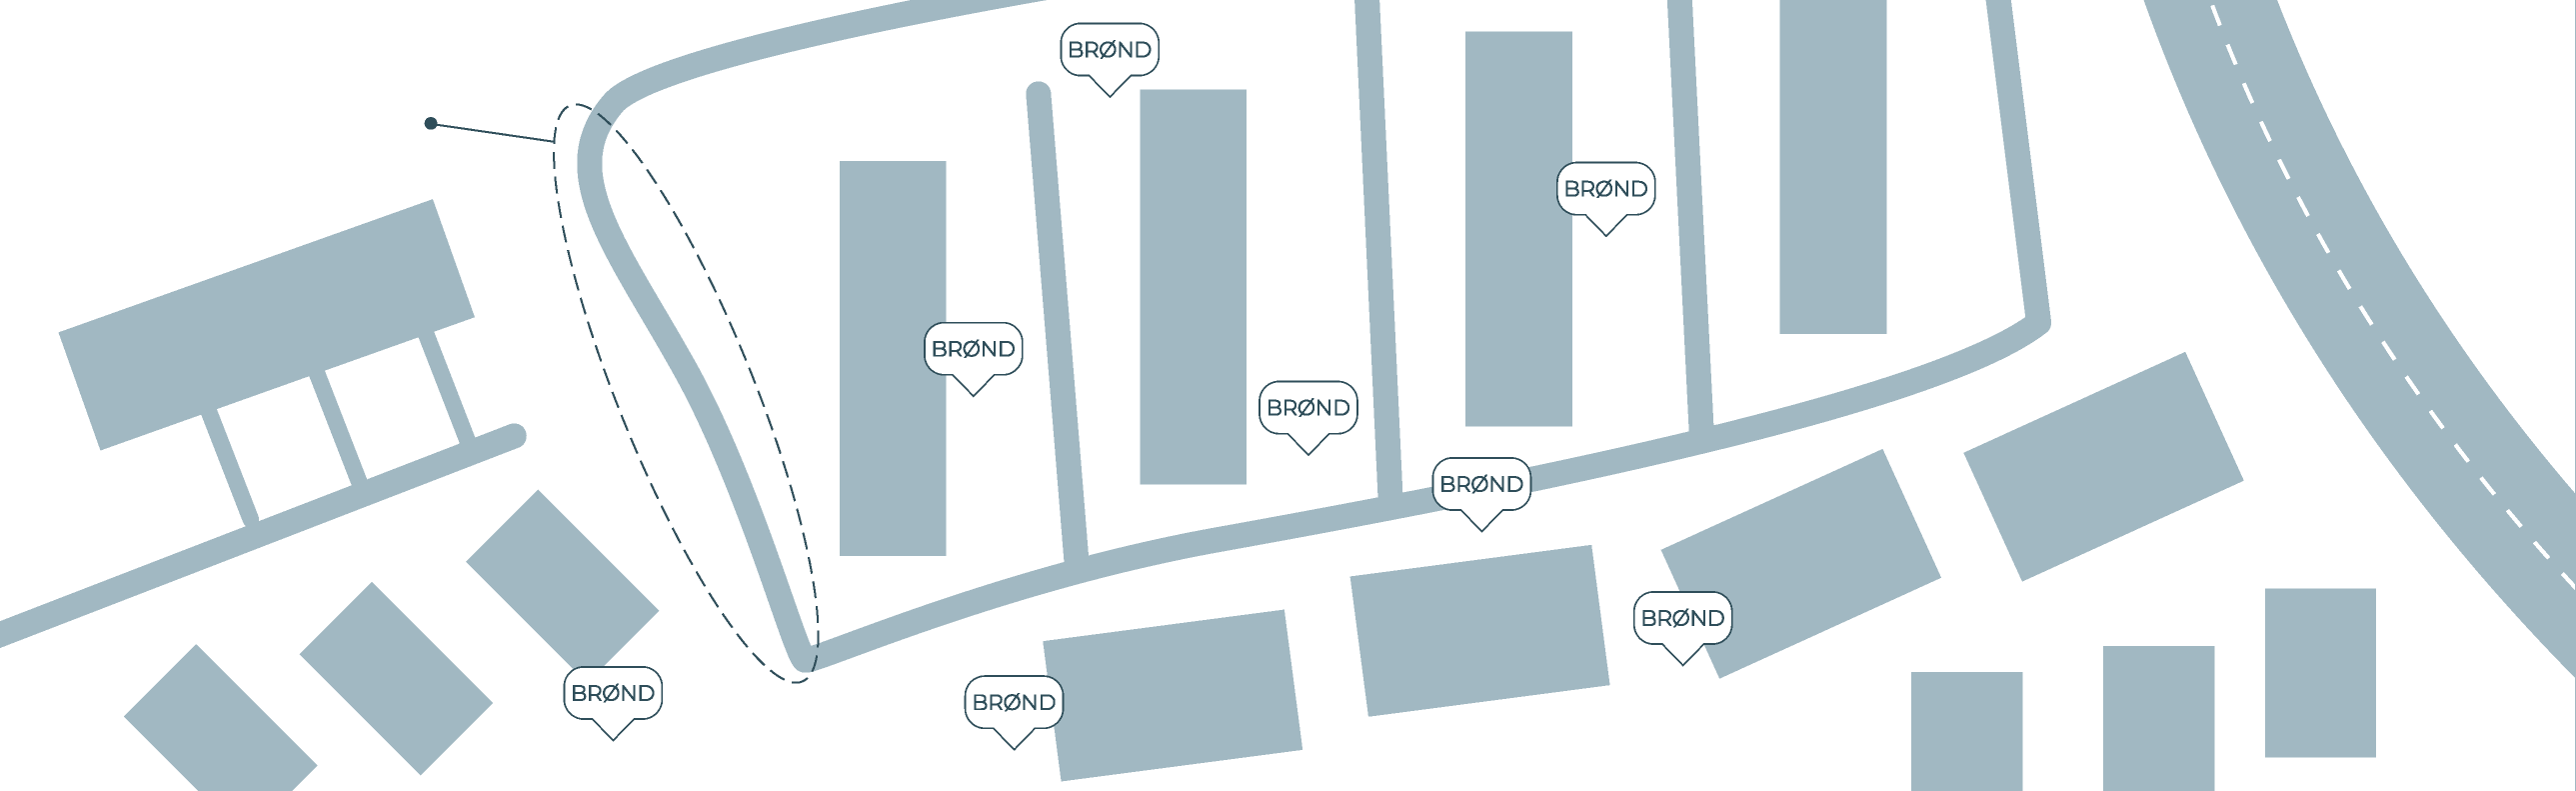
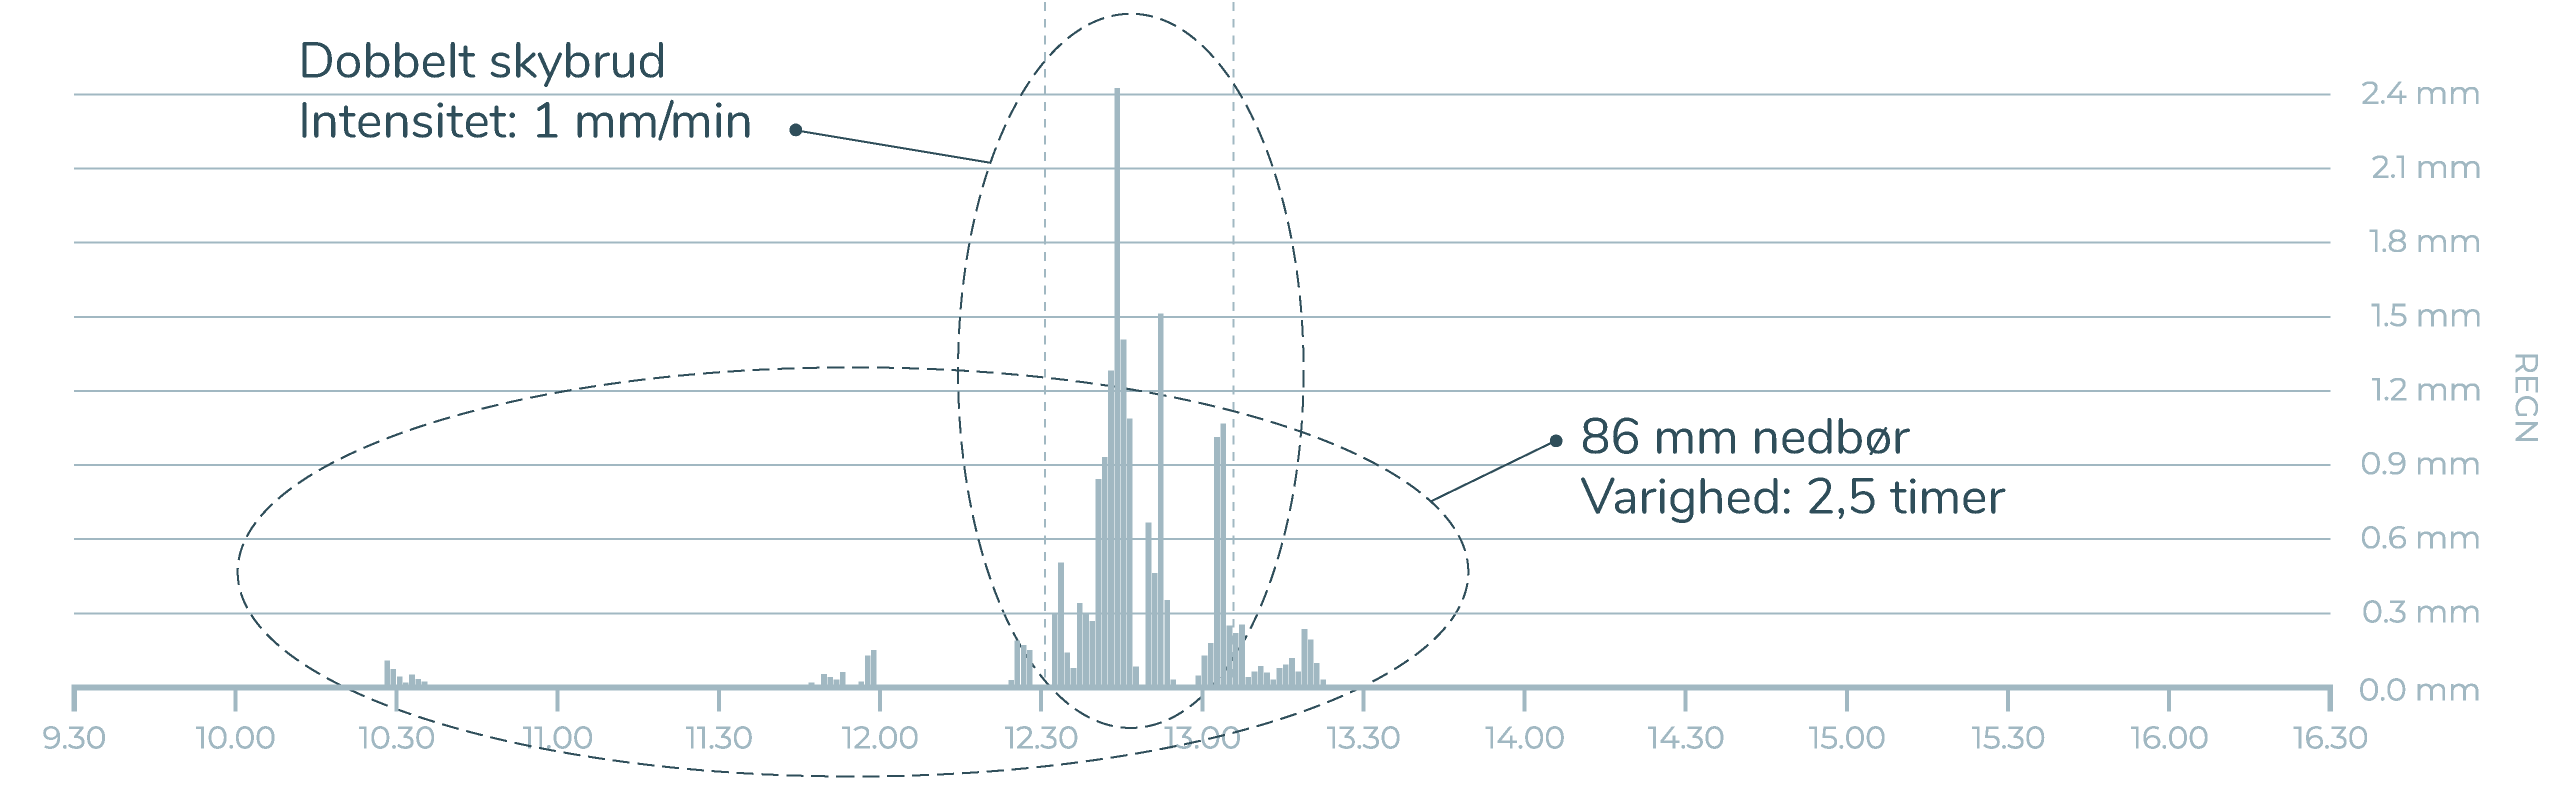
Figure 2
The platform makes sensor data accessible by displaying it in detailed graphs that enable precise rainfall-event analysis.
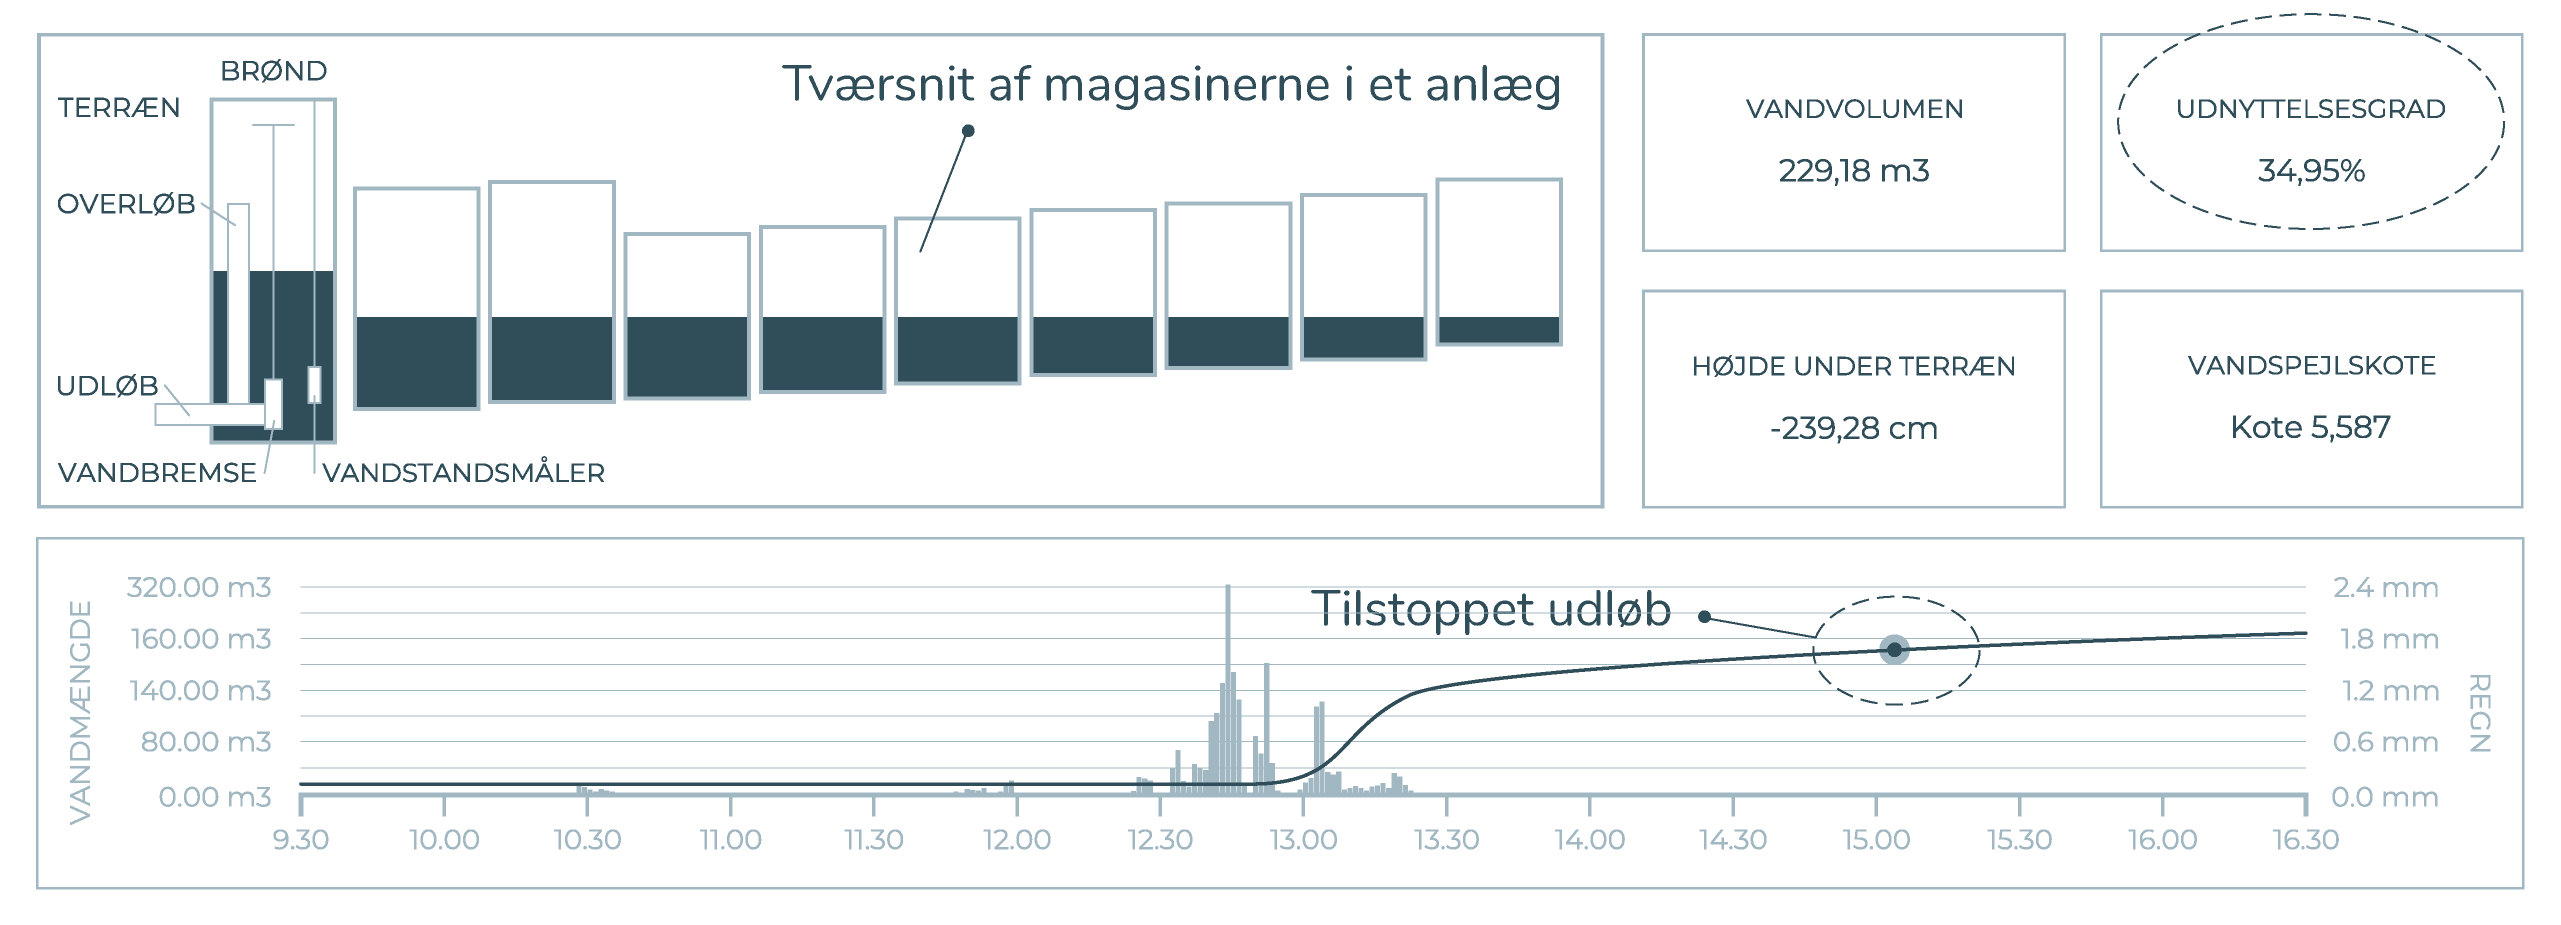
Figure 3
A cross-section of an installation's basins together with key metrics shows how well the project is performing. The cross-section and utilisation rate make it clear that there is room for improvement.
The figure also shows that the water volume in the project doesn't drop after a rainfall event, meaning the outlet is clogged. The sensor has automatically raised an operations alert.
Want to learn more?
Get in touch and we'll talk you through how the water level sensor and platform can fit into your project.
Contact us